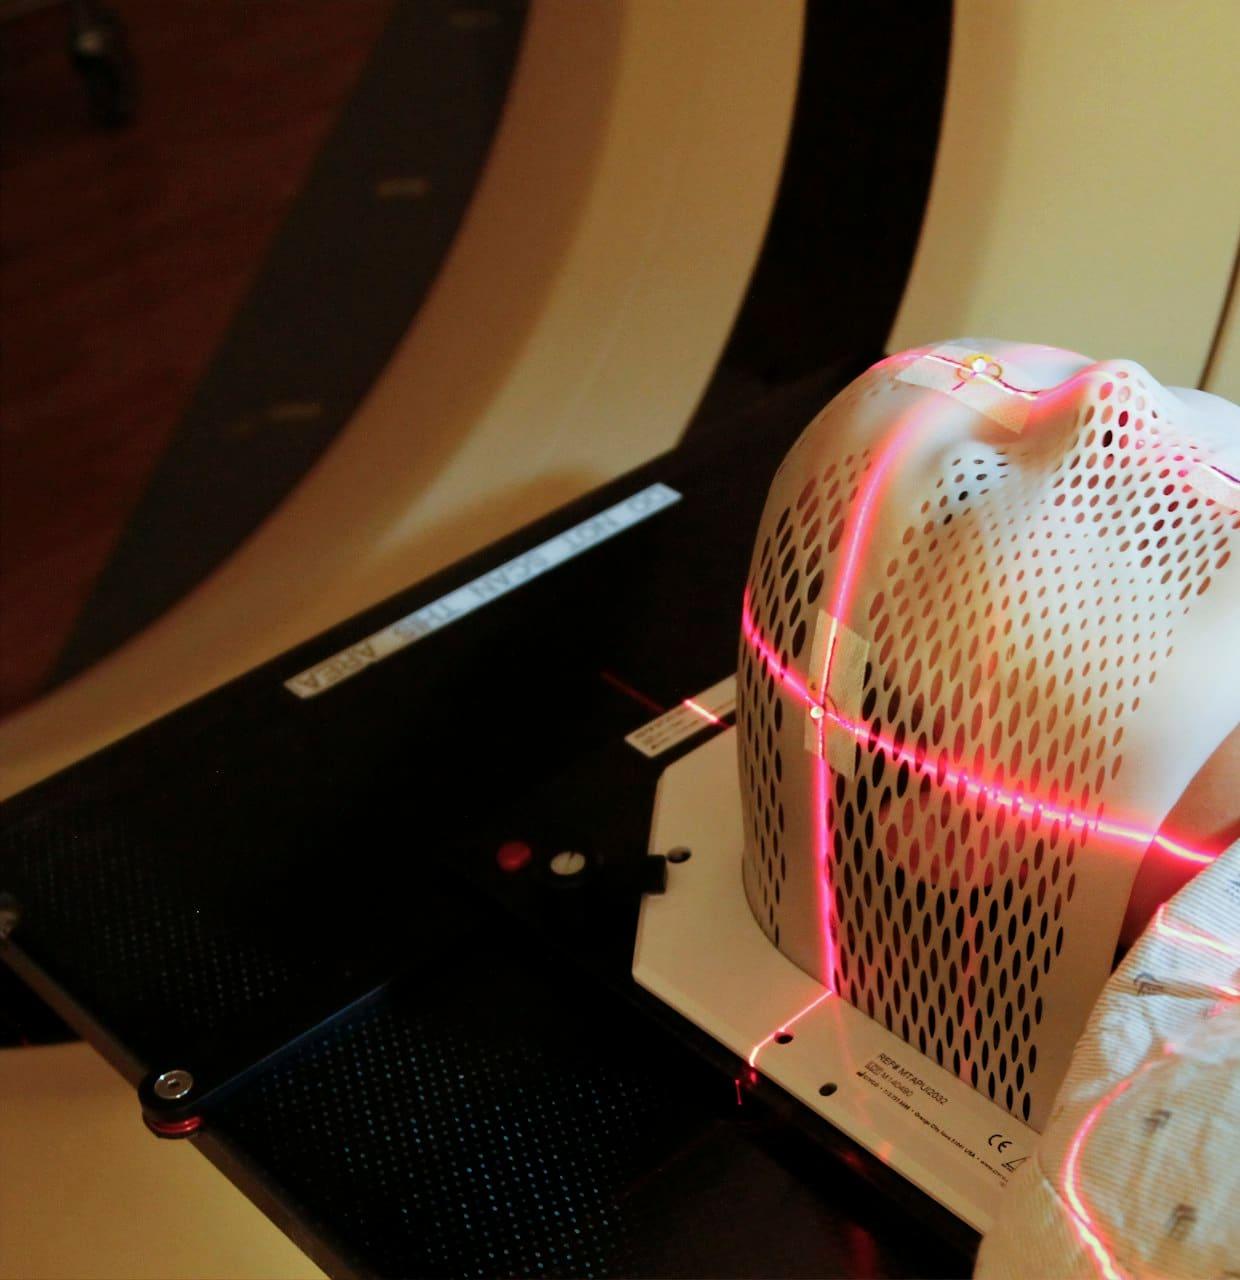
Imaging noise
Lower-dose or noisier acquisitions can hide faint findings.
Medical AI Robustness Audit
Investigate model performance under controlled imaging variations, challenging cases and dataset conditions through reproducible technical evaluation.
Built with these teams in mind
Technical evaluation for research and engineering. Not clinical validation, not a medical device and no regulatory claims.
Typical challenges
Lower-dose or noisier acquisitions can hide faint findings.
Protocol and windowing differences change tissue boundaries.
Coarser slices blur edges and merge small structures.
Populations and case mixes differ between sources.
Scanners and reconstruction settings vary across sites.
Small findings are where errors concentrate first.
Boundary and missed-region errors hidden by averages.
Good scores on one dataset may not transfer.
Proposed evaluation workflow
The proposed workflow. Each step's configuration is recorded so results can be re-run and compared.
STEP 01
Understand the task, model, data and how data may be accessed securely.
STEP 02
Agree metrics, test sets, conditions and success criteria in advance.
STEP 03
Define transformations and challenging subsets, with recorded parameters.
STEP 04
Run the model under fixed settings in an agreed environment.
STEP 05
Compute metrics overall and per condition, against the baseline.
STEP 06
Group failures and inspect representative cases with your experts.
STEP 07
Methodology, results, limitations and recommendations.
Data governance first
Research and engineering only
Technical evaluation
Which metrics are appropriate depends on the clinical research task, the data and the cost of different errors. Technical metrics do not on their own establish clinical effectiveness.
2 |A ∩ B| / (|A| + |B|)|A ∩ B| / |A ∪ B|TP / (TP + FP)TP / (TP + FN)m_condition − m_baselinefailures by categorySuitability depends on context. TP, FP and FN are true positives, false positives and false negatives; A and B are predicted and reference regions. A metric that suits detection may mislead for segmentation, and class imbalance, label quality and the cost of each error type all change which measures matter.
Evaluation report preview
An interactive, frontend-only example. All values are illustrative sample data — not results from any customer, model or study.
Robustness evaluation report
AUDIT-SAMPLE-001 · all values are illustrative
In this sample, faint findings are missed more often as noise increases.
| Metric | Baseline | Added image noise | Δ |
|---|---|---|---|
| Dice | 0.82 | 0.74 | −0.08 |
| IoU | 0.70 | 0.60 | −0.10 |
| Precision | 0.85 | 0.79 | −0.06 |
| Recall | 0.80 | 0.71 | −0.09 |
Counts of sample failure cases (baseline → selected).
The audit draws on the methodology described in our medical imaging research direction: patient-level splits, real-data evaluation, controlled conditions and explicit limitations. That research is a direction, not a clinically validated result.
Medical AI Robustness Audit
Tell us about your model, task and the conditions you are concerned about. No data is needed for a first conversation — please do not send patient data through the form.
Not a medical device. Nothing on this page is intended for diagnosis or clinical decision-making.